Tensorflow Model Optimization
2019-06-08
This post represents an experiment in eking as much performance as I can get out of an arbitrary Tensorflow model, while treating the model as a black box and avoiding the use of more than a single CPU.
This code is available in my experiments Github repository, if you'd like to follow along. More specifically, here's the commit range.
tl;dr: massive speed improvement comes from using MKL libs, compiling Tensorflow with the right instruction sets, and saving/freezing/optimizing your model file.
Starting Point
I started off by grabbing the
g2p_en
library off of Github. More specifically, I grabbed the commit immediately
before they tossed everything out and re-wrote in in numpy instead of
Tensorflow.
A couple quick refactors to remove all the training-specific code, make sure everything's working well in Python 3.x, and we've got ourself an initial commit (74def2c6). More interestingly, a barebones benchmarking script to get us started (36401b8f).
From there, we can start jumping into the good stuff.
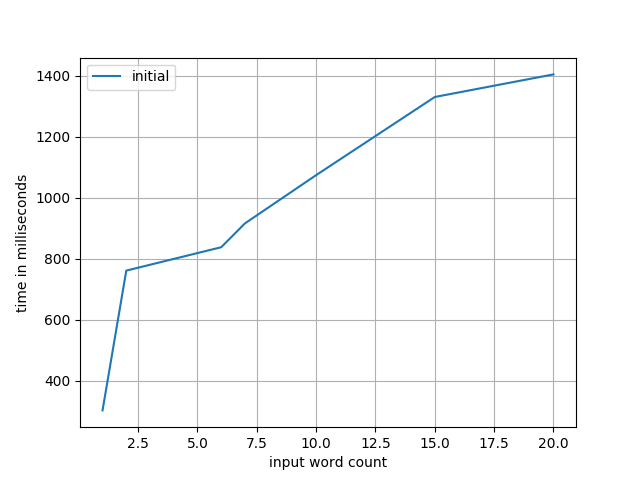
Oh yeah, that's the stuff.
Compiling with Faster Instruction Sets
One of the first things you'll notice about running Tensorflow is a whole bunch
of warnings about how everything is going to soon be deprecated, you're doing
everything wrong, your mother never loved you, and how you should have known
better than to just install Tensorflow directly from PyPI; after all, why on
Earth would you imagine installing a python package would just involve doing a
pip install tensorflow?
Nope, whenever you import tensorflow, you'll get treated to a love message
telling you just what you're missing out on:
Your CPU supports instructions that this TensorFlow binary was not compiled to use: AVX2 FMA
You might need to dig through a few pages of messages to find that, mind. I highly recommend
1 | |
Back to the instruction sets: every CPU supports some subset of a bunch of possible instruction sets. These act as extensions to how your CPU performs by providing newer (heopfully better) interfaces for some operations. You can see for yourself which ones your machine supports by running:
1 | |
or, if you're a heathen OSX user:
1 | |
More likely than not there's a huge amount of things in this list, many of
which are completely irrelevant in our case; Tensorflow really only cares about
some of these: AVX*, FMA, and SSE*. If you compile Tensorflow with flags
telling it which of these sets it can play with at run time, it will
automatically use the faster instructions whenever possible.
A couple gotchas when compiling your own Tensorflow:
your build machine and runtime machine have to be identical in all the ways that count: same base OS versions, same python versions, same header versions for anything that gets linked, same CPU architecture, etc. I highly recommend the use of Docker and prayer to make sure these stay matched up.
Any instruction sets you enable must be available at runtime or the whole thing will collapse. If your Tensorflow doesn't support some instructions you have available you just get a bit sad at the wasted time spent; if your Tensorflow is compiled with instructions that you don't have then Weird Things will happen. Best case is that everything crashes horrendously.
Tensorflow uses an outdated version of bazel as its build system. It uses it incorrectly by abusing commands which have been deprecated for years and emits literally thousands upon thousands of lines of compiler errors over the course of its several hour long compilation. When in doubt, and you should be, run away screaming.
All that aside, it could certainly be worse. Grab their build Dockerfile, adjust a few flags, then go catch a movie or two while it compiles. Here's my Dockerfile for enabling AVX2 and FMA. The relevant lines are right near the bottom.
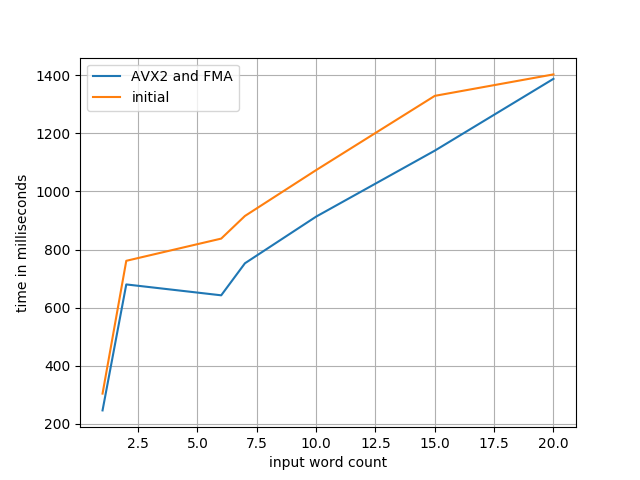
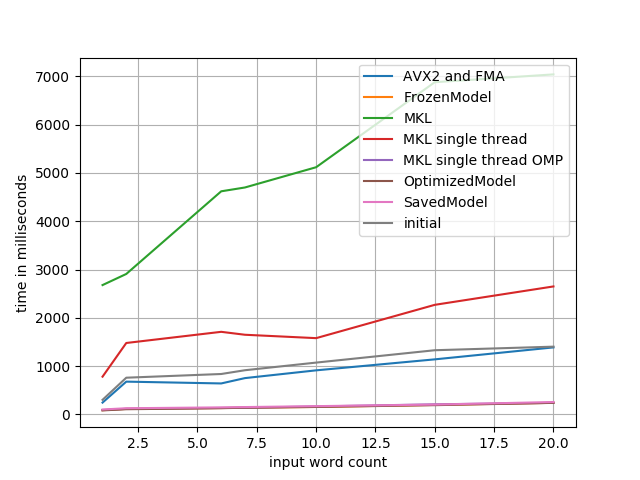
Just swapping in the manually compiled version of Tensorflow with the new instructions is enough to give us a nice little 1.2x speedup. Good start, but there are even better things to do with our compiler.
Use Intel MKL Libraries
The Intel MKL libraries are, in their own words, "the fastest and most-used math libraries for Intel-based systems". That's a bold claim, but I suppose they would know. I must admit, I didn't research whether there were any great alternatives, since Tensorflow has some MKL bindings so I knew it should be guaranteed to drop in pretty well. Plus, they're written in FORTRAN in 2019, and you've just gotta love that.
I hope you weren't following along too closely, since using the MKL libraries
are going to require re-compiling Tensorflow from scratch again. This time, we
need to
install the MKL libs
(to both your build system and your runtime one!) and drop a --config=mkl
into your build flags. If you were using clang like I was, this is also the
right time to switch to gcc, since there's some janky stuff going on in the
build that will break if you're not on gcc >= 6.2 or so.
Have you recompiled Tensorflow a second time yet? No? That's ok, I'll wait. I didn't mean to rush you.
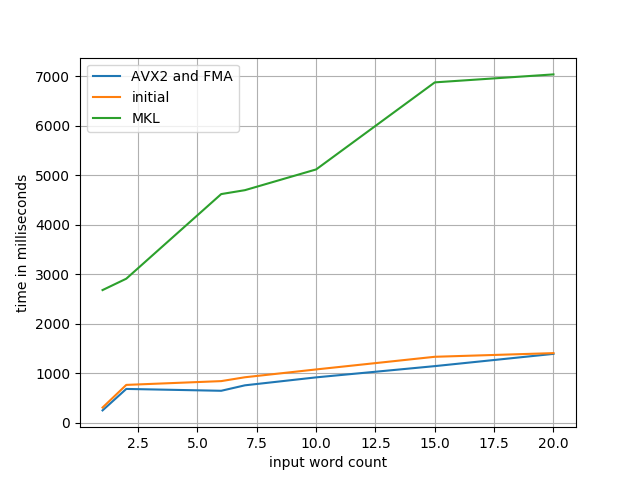
Huh, that's not good! 5-10x worse after enabling the optimized math libraries, that wasn't what I was hoping for. What could be going wrong here?
Oh -- and just a heads up, my MKL-enabled compilation is public on Gemfury, so you can feel free to save yourself the multi-hour compilation.
Fixing the Intel MKL Libraries
One of the most common tactics in making things faster is doing multiple things at once. This doesn't always work out exactly how we'd like it to (cough cough every major security issue ever) and often gives us the exact opposite result of what we're looking for. Performance-wise, this often comes down to the difference between concurrency and parallelism; concurrency is when multiple tasks can overlap in time, ie. if they both start before either end, whereas parallelism is when those tasks run at literally the same time, eg. by running on different cores or something like that.
Depending on what you're trying to do, these styles have incredibly different effects. If you're sending a bunch of HTTP requests and a bunch of your tasks are just waiting patiently for the responses, sitting idle while they wait, then concurrency is great! In that case, parallelism is entirely unnecessary; you're not really doing anything with the fact that those tasks are running simultaneously. You're... waiting extra hard, I suppose?
On the other hand, if you're trying to compute the gazillionth digit of pi, phi, e, and twelve, concurrency ain't gonna do much for you; if you're only working on one of those tasks at a time anyway, why both with the concurrency? There's always going to be at least a bit of overhead spent switching between those tasks which could be better spent by, uh, not doing that. Parallelism, on the other hand, would make this set of tasks complete much faster!
One more factor to be aware of here (well, two more, but I'll make them both short sentences, I swear). Python has a GIL (global interpreter lock), which means that only a single thread can be running at a given time; if we try to be clever by splitting one task into two with the intention of them being in parallel, but there's no spare CPU/core/process/etc to run that task on, its just going to get in our way.
Turns out that's exactly what's happening here! Tensorflow has some flags for
this in their config inter_op_parallelism_threads and
intra_op_parallelism_threads. When unset, they both default to "please guess
for me", which clearly wasn't working so great. Turns out they were looking at
logical rather than physical cores, and I'm running all these tests in Docker,
and... well, a topic for another time, maybe.
Anyway, setting these both down to 1 as they should be drastically improves
things.
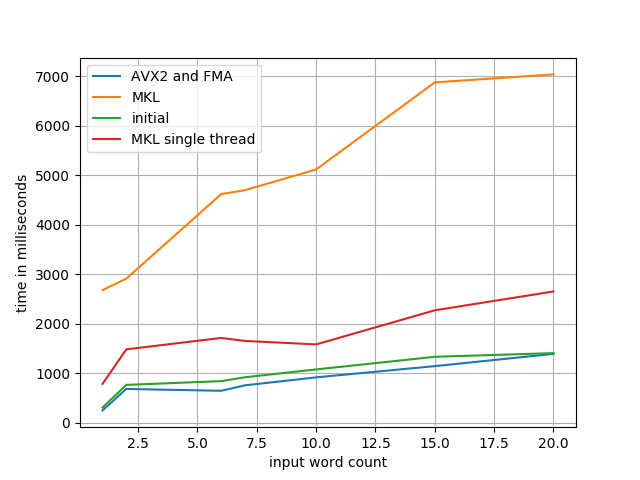
Note that things have improved but their still not actually good.
Ah! Its not just Tensorflow which has these flags. OpenMP, which is used by the MKL libraries, has its own way of doing a pretty similar thing.
1 | |
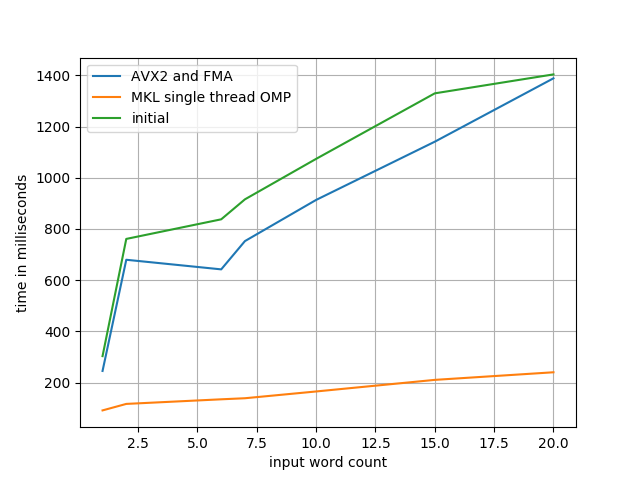
Alright, now I'm feeling pretty happy about these libraries; with a speedup of \~5.9x, we've made some great progress.
RTFM'ing
The last "obvious" thing to check would be the Tensorflow Performance Guide. A quick glance at that shows that we've mostly already followed the advice: we are using MKL, we've optimized our MKL threads, we're using a dynamic RNN rather than fully fused layers or a static RNN.
About the only thing from that guide we haven't done is avoid using the
feed_dict argument to tf.Session.run() -- but that's irrelevant in our
case, since the advantage of moving away from feed_dict is to perform
CPU-bound operations while your GPU is otherwise busy inferring. Since we're
not using a GPU at all, its time to break out a profiler and investigate for
ourselves.
Note that this (and other things that I'll be glossing over entirely) would absolutely be a great optimization to explore if we were willing to make use of a GPU. But I mean, come on: running neural nets on CPUs, who does that?
Profiling
As I turned to start doing some profiling and figure out the next big problem area to tackle, I discovered that my beloved Pyflame tool has pretty much entirely stalled its development since the original author left Uber. Since it doesn't support Py 3.7, I'll just have to fall back to my second most favouritist ptracing profiler py-spy.
That's a whole bunch less useful than I had hoped it would be. Turns out we're spending the vast majority of our time within Tensorflow on this line which is the line for, you know, running our model. I suppose I should have been a bit less surprised.
On the plus side, though, that tells us more about what to explore next: optimizing our model.
Model Saving
So it turns out that the model that had been saved to disk wasn't
actually what the Tensorflow folks call a "saved model". Model that has been
saved, saved model; two completely different things. There's a simple fix for
that, mind, using saved_model.simple_save.
1 2 3 4 5 6 | |
If the alliteration and oddly off-base naming has killed you yet, don't worry,
we'll get there. Turns out simple_save doesn't seem to actually save the
whole model. If you try to actually use the saved model, it'll complain about
missing pieces.
The solution is to grab parts of the old model (eg. some of the final checkpoint metadata) and stuff 'em into the new model. If you're trying to apply this to a different model, you'd be looking for the final checkpoint data here.
1 2 3 4 | |
At this point, we can modify our code to make use of the SavedModel, rather
than the checkpoints:
1 2 | |
At this point, we haven't actually made any changes to the model yet, other than some internal things about how its loaded, but just to double check...
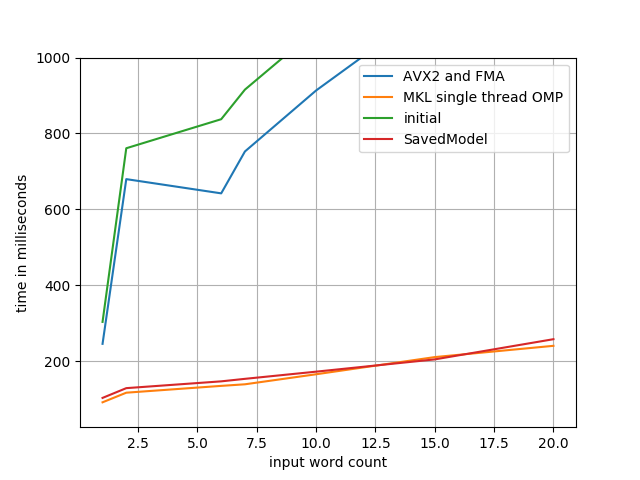
Yup, whew, no change, the world continues to make sense.
Model Freezing
Next step is to "freeze" the model, which will prune unnecessary nodes,
de-duplicate repeated variables, and generally make things const wherever
possible. This in itself has some potential to be an optimization, but not by
more than a percent or two:
1 2 3 4 | |
Note that at this point I found out that Graph.preds had not previously
been assigned a name/label and thus could not be exported, which meant I had to
go back and re-save the model after adding that label. TIL: its not the name of
the variable which is used, but the literal .name attribute attached to that
variable. For example, the following class has a variable named bar, not one
named foo:
1 2 3 | |
Anywho, this step gives us a frozen_model.pb file. Let's switch to loading
it instead of our SavedModel.
1 2 3 4 5 6 7 8 | |
Note that we no longer need to have the Graph class at all, which makes it
possible for this module to include exclusively runtime-only code rather than
including anything which is only really a part of the training step! At this
point, the model is the only deliverable we need and it can be treated entirely
as a black box. The only parts we still need to know are the shapes or the
inputs and outputs -- but it turns out we can get that back out of the model
rather than needing to pull it off of the original training object.
1 2 3 4 5 | |
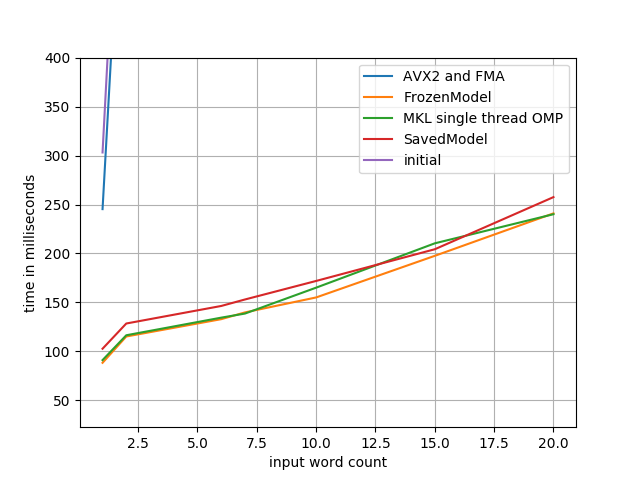
This brings us to a speedup of 6x -- technically a bit more than we had before, but nothing to write home about. Hopefully, all the biggest improvements will come in the next step (he says, as if he hadn't already done that step).
Model Optimization
So far we've done a whole lot of busy work to convert from checkpointed models to a frozen model. Now, not to say its been entirely useless: we got to trim out a bunch of code that's now only necessary for training, we cut our model size down from 4.8MB to 1.5MB, and we learned the value of friendship in the process.
But the real point of doing this this migration is so that we can make use of the Graph Transform tool. Let's apply a bunch of standard optimization transforms and see if they help. Specifically, we're going to call a bunch of operations that mostly do exactly hat they say they do:
fold_batch_normsandfold_old_batch_norms: merge batch normalization multiplications with any multiplications from the previous layer. There are two implementations of batch normalization in Tensorflow, so we need to specify both.fold_constantsmerge_duplicate_nodesremove_nodes(op=Identity): strip identity operations (eg. no-ops) from the model. Note that this operation will break your model if you use control flow operations (as we do), so I won't be applying it.remove_nodes(op=CheckNumerics): this one also isn't always safe to remove; it is meant to catch NaNs and Infs getting passed in. In our case, we know our inputs must already be non-negative integers (and pretty darn small ones at that), so we're good to remove these.strip_unused_nodes
These transformations will get applied in the order we specify, so its important to eg. remove unused nodes before folding constants, since the removal of unused nodes may make the constant folding catch more cases.
1 2 3 4 5 6 7 8 9 10 11 12 13 14 15 16 17 | |
With a speedup of 6.19x, we're making (some) progress, though I'll admit I'd been hoping for more.
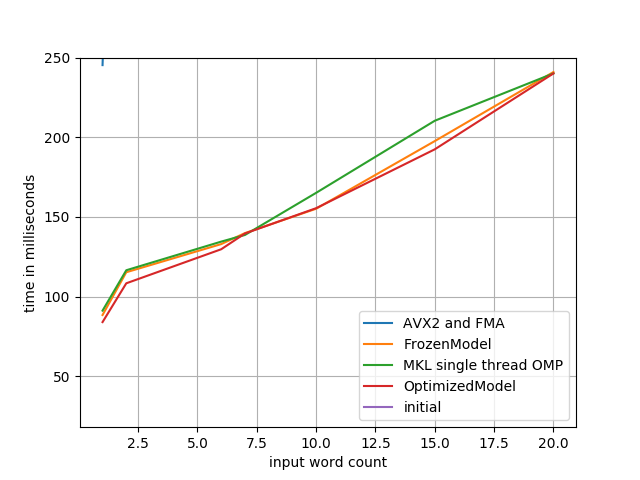
There's a few other transformations which could be helpful in optimizing performance but do so at the expense of accuracy, which is a whole can of worms I don't want to open at the point. If you're interested, grep for "quantize" in the Graph Transformation docs.
Profiling, Again
That about covers all I know about optimizing Tensorflow itself -- but what
about the rest of our codebase? Let's do some more profiling -- this time with
the line_profiler module, since
getting a line-by-line look at the g2p.predict method will hopefully show us
something exciting.
1 2 3 4 5 6 7 8 9 10 11 12 13 14 15 16 17 18 19 20 21 22 23 24 25 26 27 28 29 30 31 32 33 34 35 36 37 | |
Or, you know, maybe not. A bit of low-hanging fruit in the unnecessary _preds
assignment, but overall there's very little to do here. The Tensorflow
operations take such a vast majority of the time spent that everything else is
completely eclipsed.
Either way, this is a pretty nice place to be. Our final results definitely show some great progress having been made. Let's take a look at our range of results and bask in our glorious evolution.
Final Thoughts and Follow-Up
So how would we draw out even more power here, if we want to go absolutely crazy?
GPU decoding, of course. Not just for the speedup, but also for the batching: on a GPU, we'd be able to run multiple inference tasks at once, and do all our CPU-bound work in the meantime.
Model-modifying changes. Things like quanitizing our data down to a smaller byte size or playing with alternate model architectures which aren't quite as heavy-weight.
Dump Python. Python's Tensorflow implementation is decent, but switching over to, say, C++'s Tensorflow Serving architecture could be a whole bunch faster. I'm not 100% sold on the idea of their standard approach of building a client/server architecture and interacting via gRPC, but I'm sure the runtime is faster.
Take a look at the Tensorflow internals. There's no way they've implemented every possible speedup, there's gotta be improvements which can be made.